This set of scripts recalculates the 2012 Pennsylvania election for House of Representatives using alternative districts. Using the algorithmically derived districts from B-Districting that are purely population-based, it calculates an outcome of 9 Republican representatives and 9 Democratic representatives. The actual outcome was 13 Rep. and 5 Dem., even though the Democratic candidates received over 70,000 more votes as a whole.
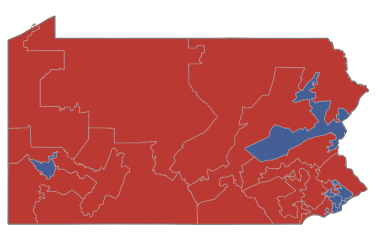
The 2012 election looked like this:
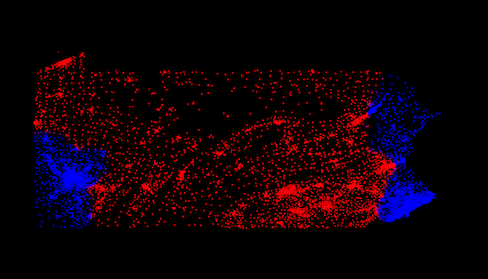
When an election using the population-based districting looked like this:
Usage
(This script requires some familiarity with Python and MongoDB.)
First, install the requirements and prepare the database:
pip install -r requirements.txt- Start an instance of MongoDB, which stores the processed data
Then, load and process the data:
- Unzip
data.zip, unpacking the/datadirectory - Run
python load.pyto load the data from/datainto the database - Run
python compute.pyto execute various manipulations of the data, including distributing the votes to the blocks
Next, generate some visualizations with python visualize.py. This will create images of votes, like the one above. It also will calculate and display the results of an election using the alternate districts.
About
Why
In the 2012 general election for House of Representatives, voters in Pennsylvania cast 2,722,560 votes for Democratic party candidates, and 2,651,901 for Republican party candidates. However, the end result in representation was 13 Republican representatives to 5 Democratic representatives. The national picture wasn't much different.
Pennsylvania, like many states, has some funny looking districts. The cause is generally gerrymandering, the practice of manipulating district shapes to achieve an electoral outcome. The question is, how much does this manipulation impact the representation? The disconnect between overall party votes and elected representative parties suggests quite a bit.
There are several projects that attempt redistricting using algorithmic, automated approaches that are purely population based, instead of the manual, corruptable approaches currently used.
There are also some neat tools for exploring redistricting, like District Builder.
Because voting tends to be regional, the factor that makes gerrymandering possible, the way to measure the effect of gerrymandering, and redistricting in different ways, is proportion of elected parties to votes. The goal isn't proportional representation, but rather reducing the bias toward a particular political party based on deliberately manipulated district shapes.
How
Take votes to each party by county, distribute those votes to the census blocks that make up the county by their share of the population, then recalculate the elections using districts calculated by bdistricting.com.
The assumption is that people in one block would vote for the same party if the block is moved to a new district (and new contest with different candidates). There are definitely cases where people vote for the candidate against the party. Scraping the vote data from the state website pulled votes for all contests, and a few counties did vote differently for president versus house, in terms of party. However, this difference was minimal.
Flaws
As mentioned before, this method ignores the realities of the candidates, and treats votes as for parties, not candidates. It also is not completely accurate, as the most precise vote information used is county-level. Recalculating the election using current districts gets two close contests wrong (but just barely). Block-level would be ideal, but is impossible to get. Precinct-level, which is then distributed to blocks, is the next best thing, but compiling and structuring all that data is a daunting challenge. County websites are miserable, and the precinct data, if at all available, is not provided in a standard format.
TODOs
Accuracy
Short of getting precinct-level data, one possible method to explore alleviating the accuracy problem would be to distribute the votes by original district as well, and use the difference between the district-level votes and the county-level votes to adjust the votes in each block. The Department of State will have the more precise data available as early as January (by CD for 10$ — how quaint).
Another source of inaccuracy is turnout. Voter turnout in districts safe for one party may be lower. The precinct data has turnout information, so adjusting for turnout in each area may yield different results.
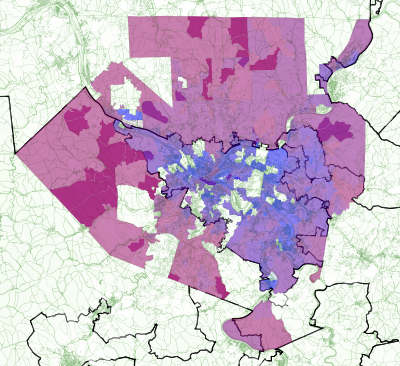
Sample precinct data for Allegheny County
Experimenting with some of this data:
Alternate districts
It would be neat to try this with different districts, such as the RangeVoting Splitline districts. This will require mapping the districts onto the census blocks. This shouldn't be too difficult, since the block groups have coordinate information, and MongoDB supports geospatial queries.
Country-wide
It would be even more interesting to see this recalculation on a national level, since Pennsylvania is hardly alone in gerrymandered districts. This requires getting vote data on a county level.
Improved visualization
The images don't show the district borders. Adding in that sort of information about the districts would be helpful (and goes hand-in-hand with alternate districts that are not census block-based).
TileMill is really helpful for this sort of thing.
Census Blocks
Blocks are identified using a 15-digit number, looking something like 420010301011000.
Format: AABBBCCCCCCDDDD
The first digit of the tabulation number is the block's group number. The block with ID 42001030101100 has a group number 1 and is in block group 42001030101.
Data Files
A set of files that describing each block, its location, and its district information. Most are downloaded from census.gov.
42_PA_CD113.txt
Assigns census blocks to Congressional districts for the 113th Congress.
BLOCKID,CD113
420010301011000,04
420010301011001,04
…
CenPop2012_Mean_BG42.txt
Lists the census block groups, their populations, and centers in latitude and longitude. Groups are identified using a number that's the same as the blocks, but with the group number instead of the tabulation number.
STATEFP,COUNTYFP,TRACTCE,BLKGRPCE,POPULATION,LATITUDE,LONGITUDE
42,001,030101,1,2580,+40.015805,-077.081172
42,001,030102,1,1136,+39.940818,-076.995904
…
PA_Congress.csv
The B-Districting districts, assigned to census blocks.
420010308003003,9
420010308003004,9
…
Downloaded from here.
PA_county_fips.csv
A list of Pennsylvania counties and their corresponding FIPS code.
Adams,001
Allegheny,003
…
2012_PA_county_data.json
Generated from county vote information scraped from the Pennsylvania election returns site.
[
    {
        "raw": {…},             # The raw data from the site, by contests.
        "votes": {              # The votes organized by party.
            "senate": {
                "rep": 25209,
                "dem": 15582
            },
            "president": {
                "rep": 26490,
                "dem": 14893
            },
            "house": {
                "rep": 27142,
                "dem": 11955
            }
        },
        "fips": "001",
        "id": 1,
        "name": "Adams"
    },
    …
]
More information
- Census products
- TIGER shapes (ftp - organized by county)
- Census Block assignment files
- TileMill - for making visualizations
- pyshp - Python shapefile library
- Kartograph - Python and JavaScript mapping libraries
- Using MongoDB to store geographic data
Authors
License
Unlicensed aka Public Domain. See /UNLICENSE for more information.